Home›Newsletters›Issue 1
Tuesday, 10 November 2026
Flows, Not Fundamentals
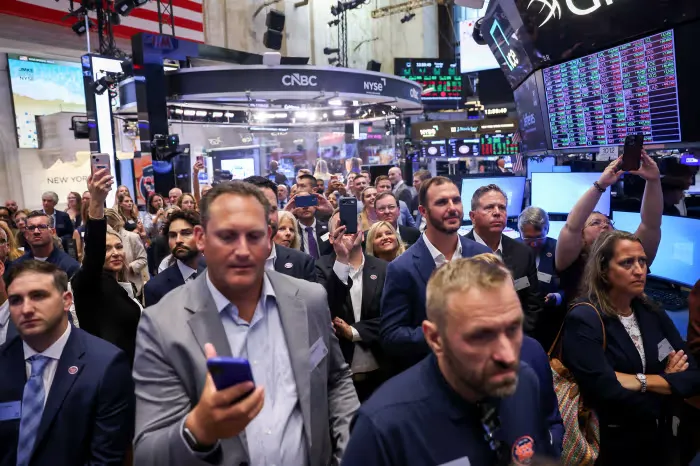
The rotation into safety
To understand last Thursday you have to start a month earlier. Through October the dominant flow in US equities was rotation, not selling. A heavy earnings season, a packed catalyst calendar and the corporate buyback blackout, the weeks before earnings when companies cannot buy back their own stock, all landed at once. With the largest structural buyer sidelined, investors took profits in semiconductors and AI infrastructure and moved into sectors that hold up when uncertainty rises: financials, utilities, consumer staples and healthcare.
We positioned for exactly that, with a pair trade long the defensive sectors and short semiconductors. It worked. Semiconductors (SOXX) fell roughly a third from their early-October high and still sit well below their 200-day average, while healthcare, staples, financials and utilities rose 10–13% from their autumn lows. Utilities stand out after months of heavy selling, and even the cyclical laggards, discretionary and materials, joined in.
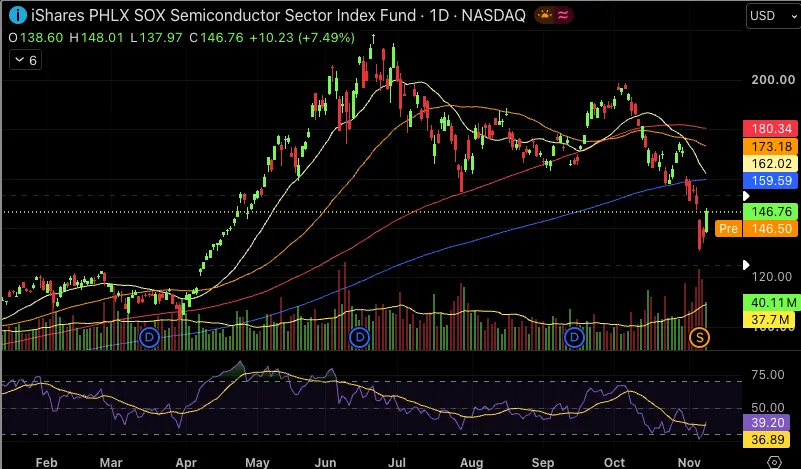
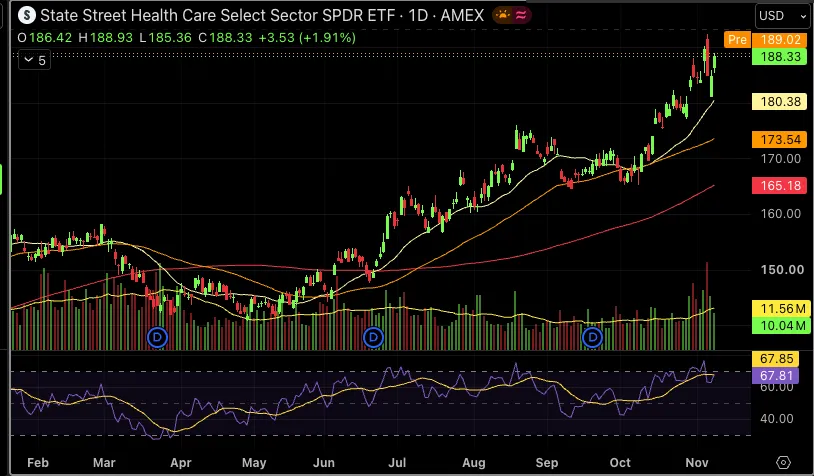
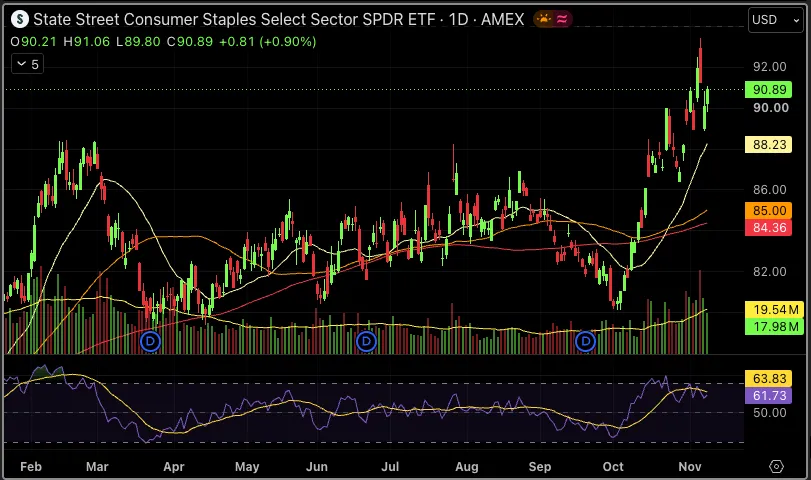
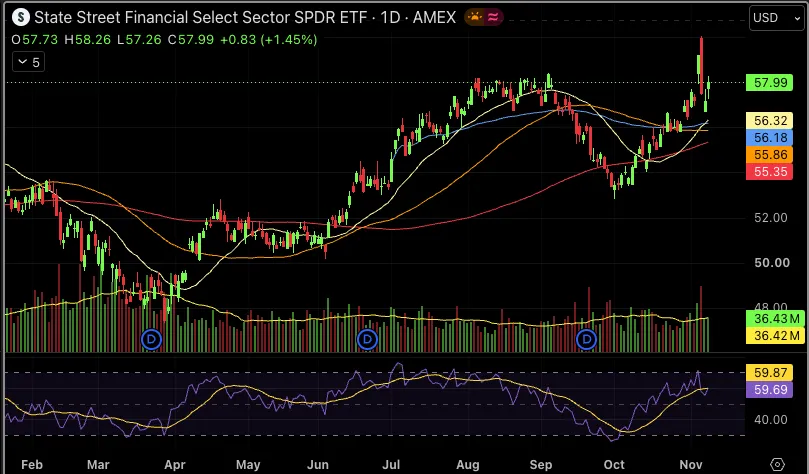
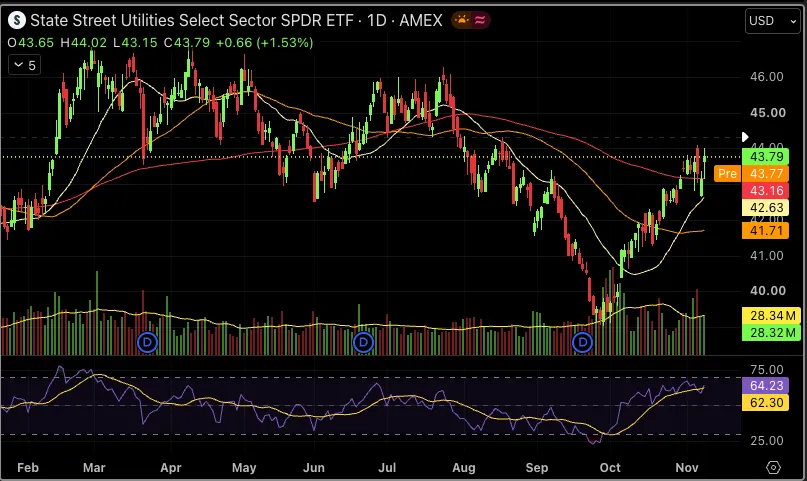
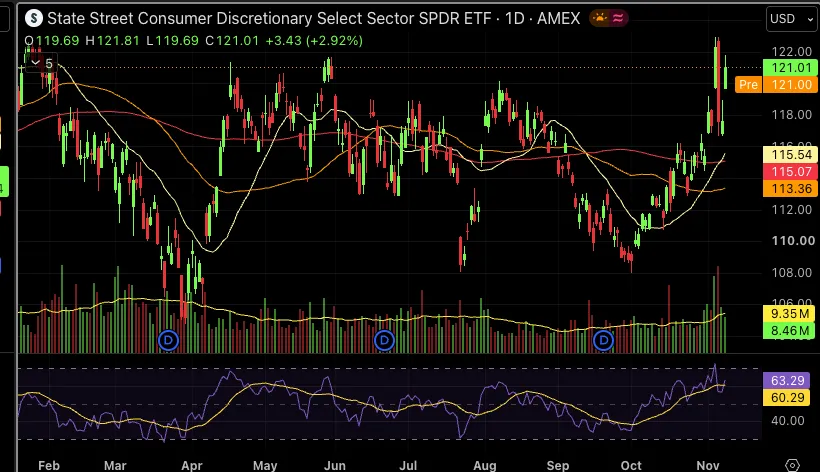
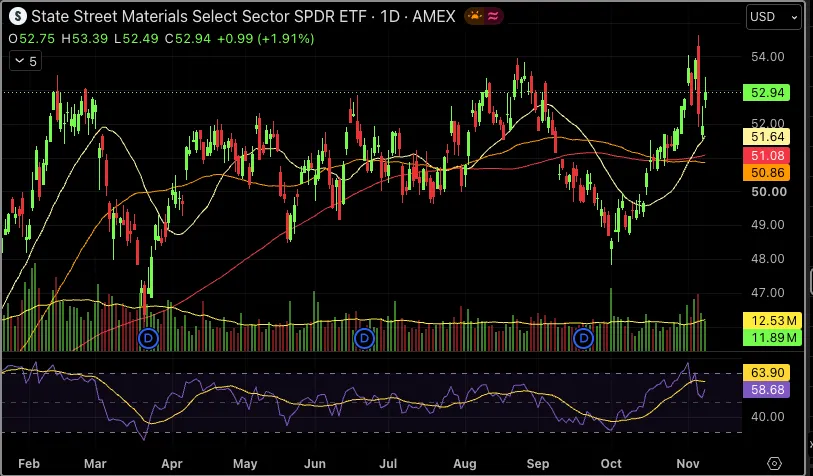
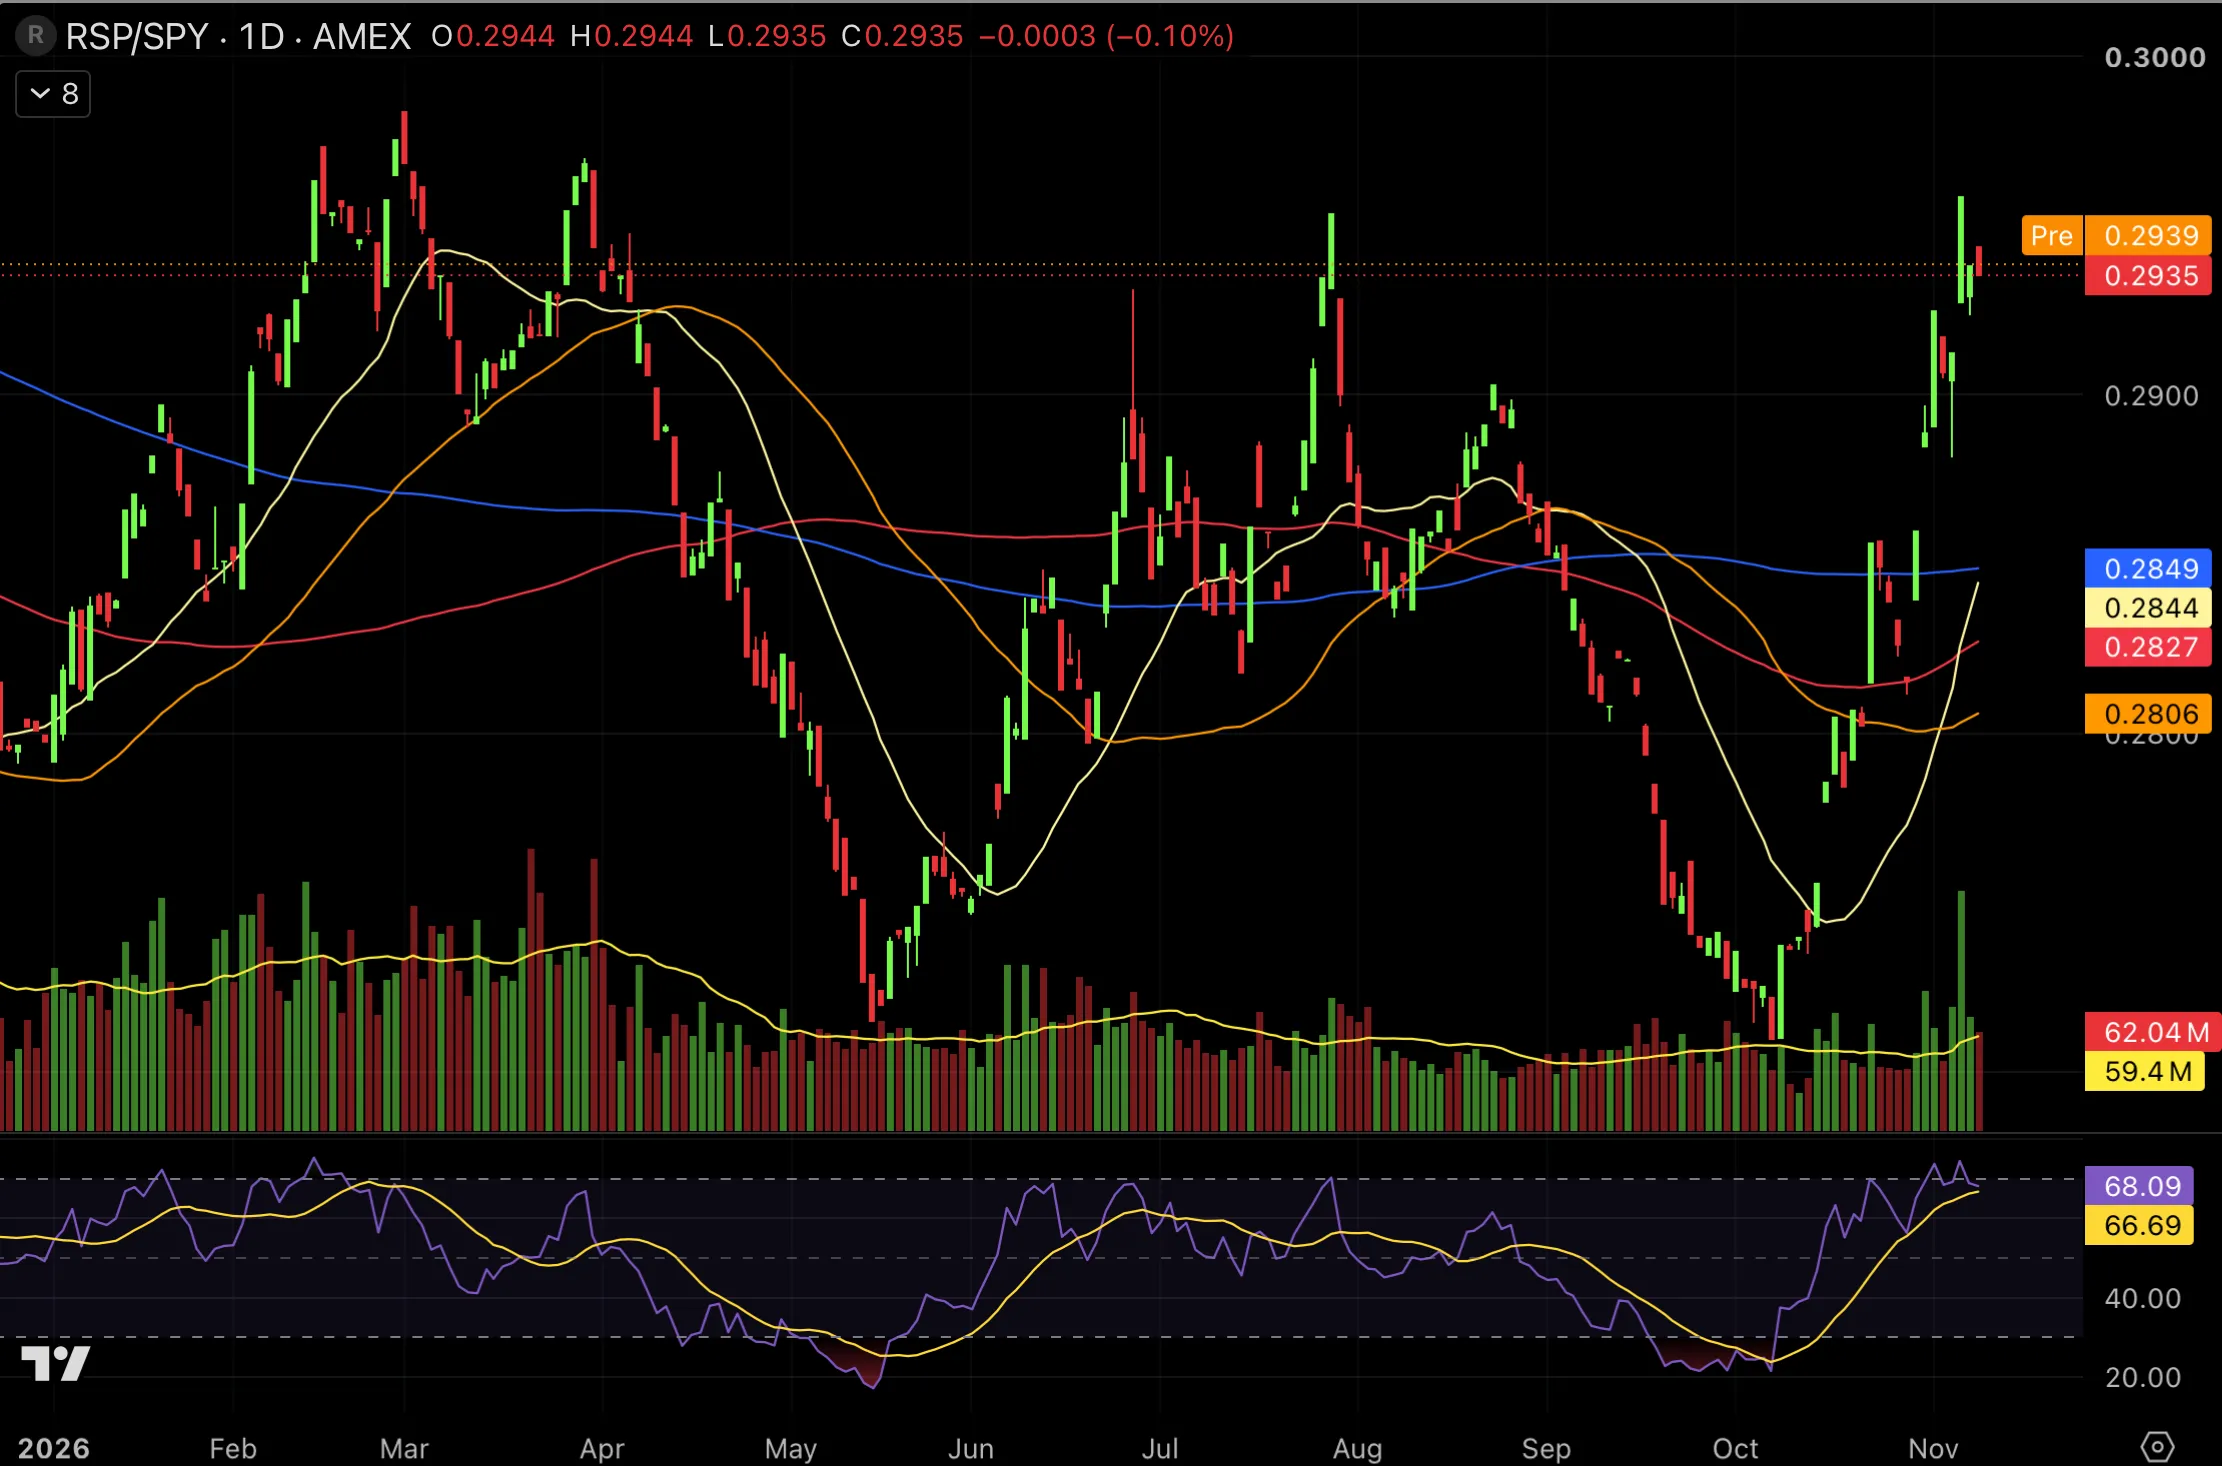
The equal-weight to cap-weight ratio (RSP/SPY) shows the rotation in one line: it has climbed from its October low to the top of its range for the year. It also explains why the index barely moved in October. The S&P 500 is weighted by market value, so gains in hundreds of smaller stocks were offset by losses in the few AI giants that drive it. The reverse is also true: when money rotates back into the mega caps, the S&P 500 rises much faster than the average stock. That is the move our NVIDIA trade is positioned for.
By early November, then, the market had already been de-risking for weeks. It was lighter in AI, but still sitting on a large pool of systematic positioning that responds to price and volatility, not to views.
Thursday 5 November: anatomy of a mechanical sell-off
A one-day post-election rally
US stocks tend to rally after midterms, once the uncertainty clears, and on Wednesday they did: Democrats won both chambers of Congress and the market posted its best session in three months. By Thursday the reading had changed. Divided government means slower legislation and less fiscal support, and Democratic gains in states where opposition to data centres has been building raised fears that policy could slow the AI build-out. Investors read the result as disinflationary but growth-negative, and a market sitting on large AI gains began to take profits.
NVIDIA then took a second hit. Over the weekend, reports linked an executive at a Singapore-based customer under US investigation to Chinese intelligence, drawing in CEO Jensen Huang, and the stock fell again on Monday. Nobody has accused NVIDIA or Huang of wrongdoing, but in a shaken market a headline like that hits the most crowded stock first.
Thursday 5 November
- S&P 500
- −4.36% to 7,353.73: worst day since April 2025, closing near the session low
- Nasdaq Composite
- −5.5%, into correction territory
- NVIDIA
- −9.3%, the single largest drag on the index
- VIX
- +69.7% to 28.18
- Volume
- 26.9bn shares vs. 17.7bn 20-day average
- Breadth
- Decliners beat advancers 6.1 to 1 on the S&P 500
An election result does not change a single company’s earnings this quarter. A 4.4% drop needs a bigger explanation: who was forced to sell, and when.
The mechanics: how a sell-off feeds itself
The first group of forced sellers is CTAs (Commodity Trading Advisors), systematic trend-following funds. They add exposure when prices trend higher with low volatility and cut it when the trend breaks or volatility rises. Because they follow similar rules, they sell together, in size, and their selling can be estimated in advance.
This is why we turned cautious before the sell-off. Early last week, Goldman Sachs’ CTA model showed flows close to zero in a flat market, but in a falling market about $40 billion of selling within a week and $164 billion over a month, roughly $69 billion of it in US equities. A modest decline would unlock a very large seller, and on that basis we flagged that we would be looking for protection into the week. On Thursday, that seller arrived.
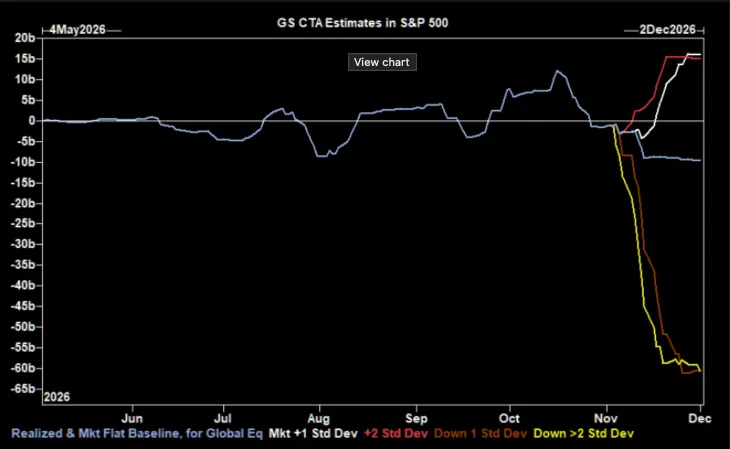

The same model projects about $120 billion of buying over a month if the market keeps rising: the force that accelerated the sell-off can just as easily fuel the recovery. Goldman’s key thresholds are 7,713, 7,544 and 7,082, with the medium-term 7,544 the most important. Holding above it is the line between CTAs as sellers and CTAs as buyers.
CTAs explain where the selling came from; dealers explain why it accelerated. Options dealers, the banks and market makers on the other side of investors’ trades, stay neutral by hedging in futures and stock. When they are short gamma, as they were last week, that hedging works with the move: they sell as the market falls and buy as it rises, amplifying moves instead of absorbing them.
Put the two together and you get Thursday. Profit-taking pushed the market lower, tripping CTA sell signals. CTA selling pushed it lower again, forcing dealers to sell more to stay hedged. Volatility-control funds, which cut exposure as volatility rises, added another layer. The loop ran into the close, which is why the index finished near its low on very heavy volume.
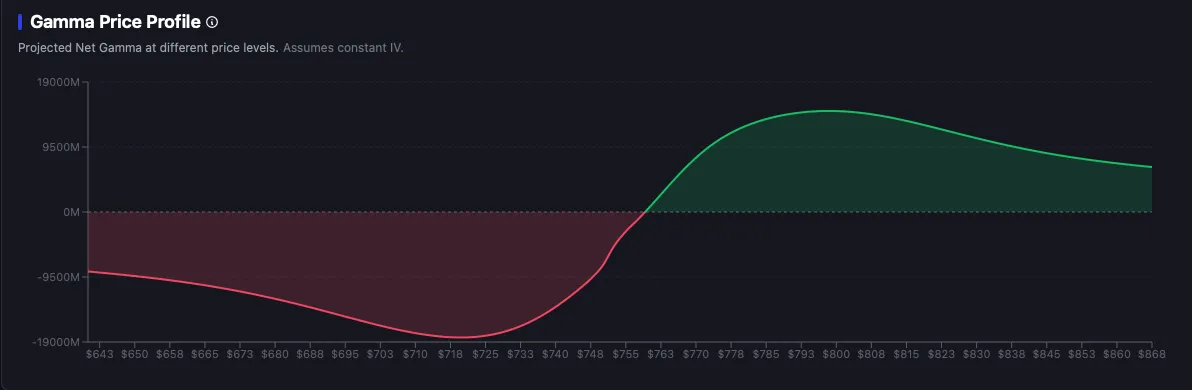
The key level is the dealer ‘flip’, where gamma turns positive. On SPY it sits at about $760, only 0.8% above spot at $754, roughly 7,600–7,650 on the S&P 500. Above it, dealers buy dips and sell rallies, and ranges hold. Below it, negative gamma deepens quickly towards $720, about 4–5% lower, with the largest put concentration at $729. Call gamma builds steadily towards $800, and heavy put positioning at $750–760 expires on 20 November, removing a source of downside pressure.
The volatility tell: panic, but short-dated
Thursday produced the third-largest one-day jump in the VIX since 1990, from 16.6 to 28.2. About 800,000 VIX calls traded by midday, three and a half times normal, and demand for S&P 500 puts surged. But the fear sat almost entirely at the front: nine-day implied volatility hit 31.4 while six-month and one-year barely moved, at around 25. The market priced a dangerous few weeks, not a bear market. In a genuine regime change, the back of the curve moves too.
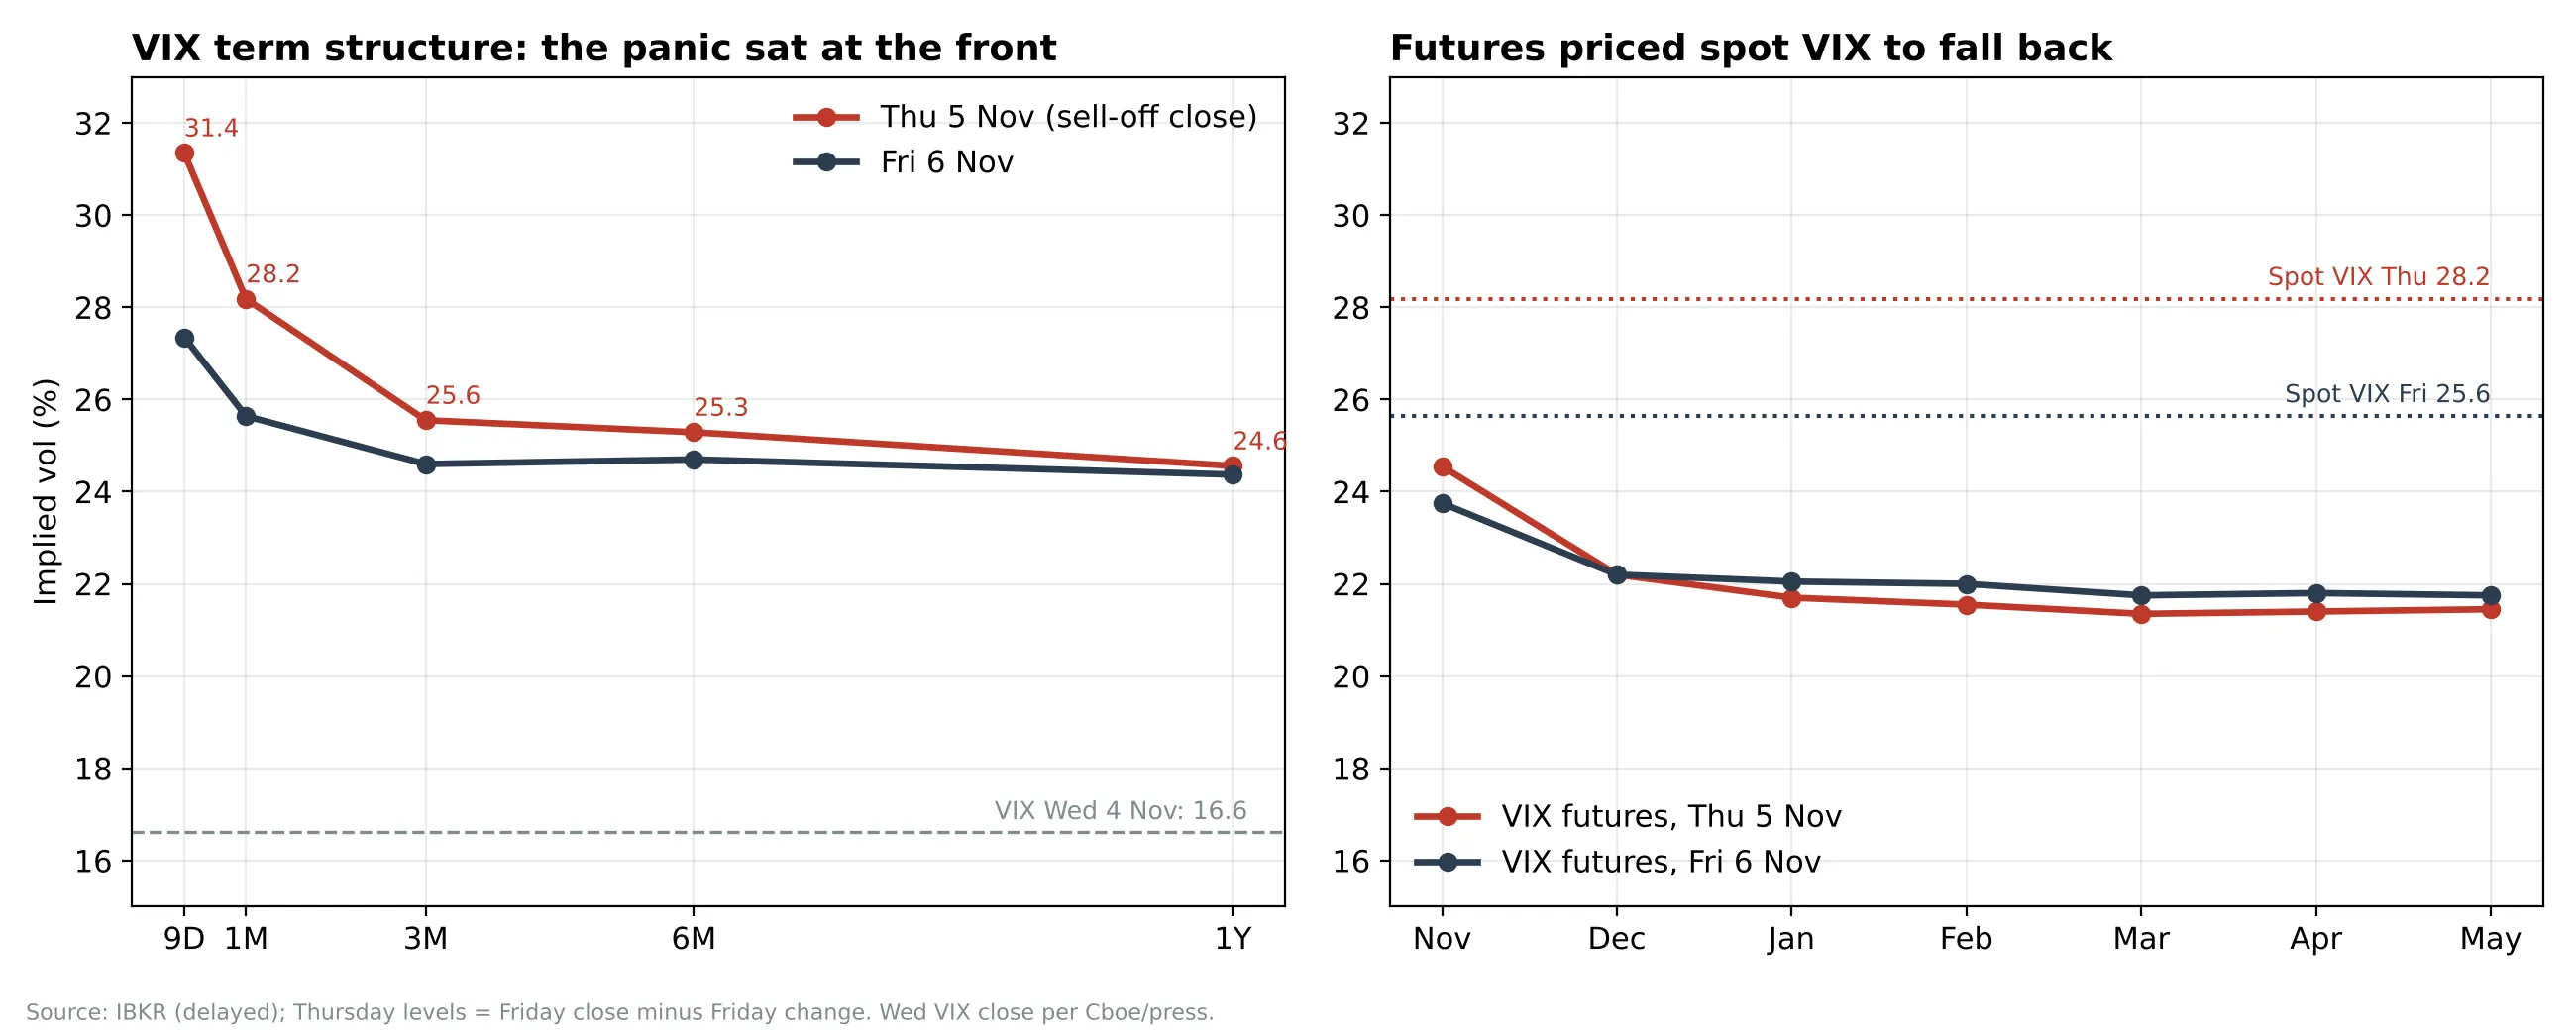
VIX futures agreed: with spot at 28.2, November traded at 24.6 and December at 22.2. On Friday the unwind began, with the VIX down 9% and the VVIX down from about 135 to 122. As the VIX falls, the puts dealers are short lose sensitivity and dealers buy back their hedges, a flow known as vanna that can fuel a rebound on its own. After the last ten one-day VIX jumps of 50% or more, the S&P 500 was higher a month later in nine, according to Yahoo Finance.
The rebound: do we believe it?
The S&P 500 found its floor almost exactly at the 200-day moving average, and the next two sessions delivered a strong rebound on solid volume. Futures are back around 7,609, above Goldman’s 7,544 CTA threshold. Because so much of the decline was mechanical, we think most of the recovery is real, and its breadth supports that:
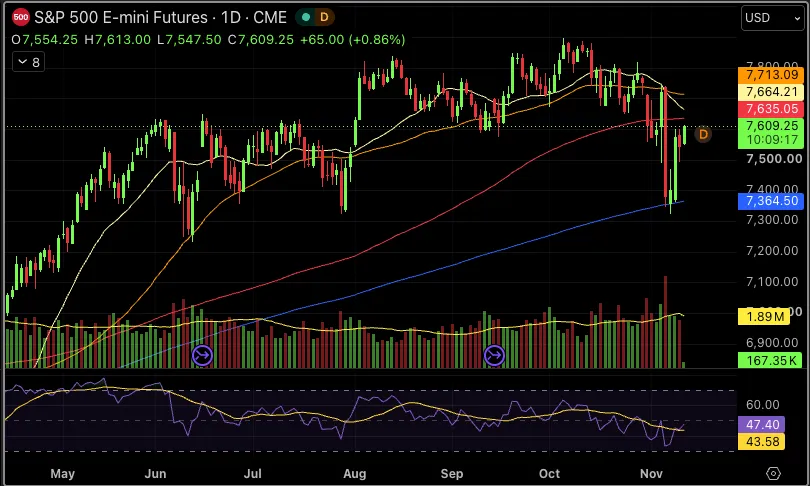
- It is broad. Nearly every sector is bouncing, equal-weight RSP has recovered almost all of the decline, and the under-owned Russell 2000 is recovering as yields fall.
- Credit agrees. High-yield and investment-grade credit ETFs are being bought back.
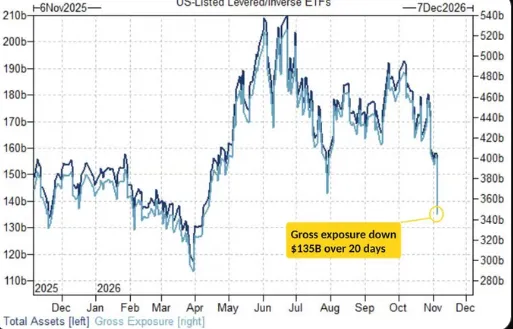
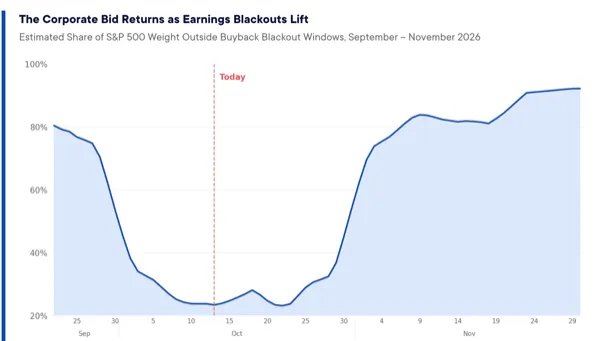
- Fewer forced sellers, more structural buyers. Leveraged and inverse ETFs, which must rebalance into the close and amplify big moves, have shrunk by $55 billion in 20 days, with gross exposure down $135 billion (Goldman Sachs). At the same time, companies are leaving their buyback blackouts.
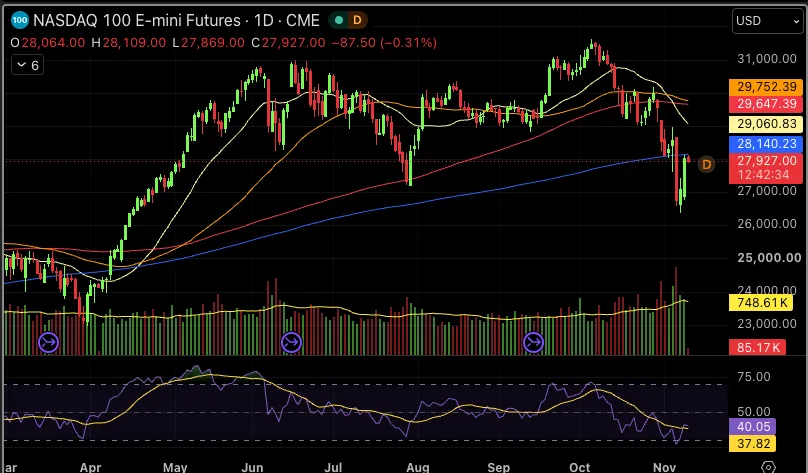
- The weak link is AI. The Nasdaq 100 is still below its 200-day average and semiconductors well below theirs. That unrepaired gap is what our NVIDIA trade is designed to capture.
The signals we are watching
Our view rests on the move having been mechanical. If it was not, the evidence will show up first in credit, rates and volatility.
Supportive Watch
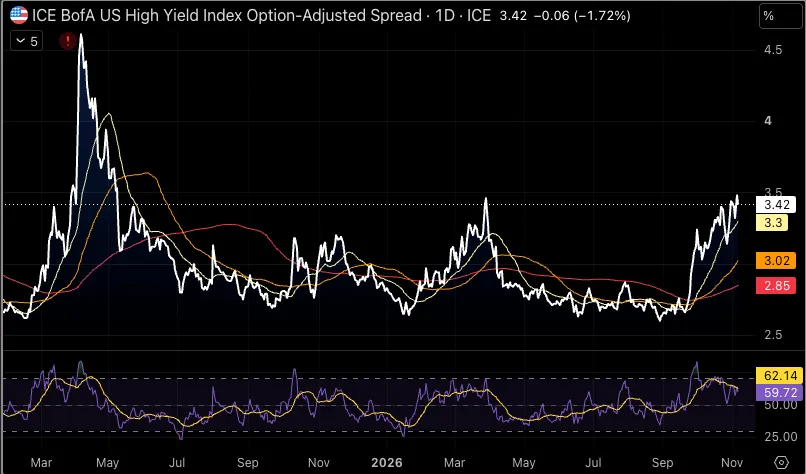
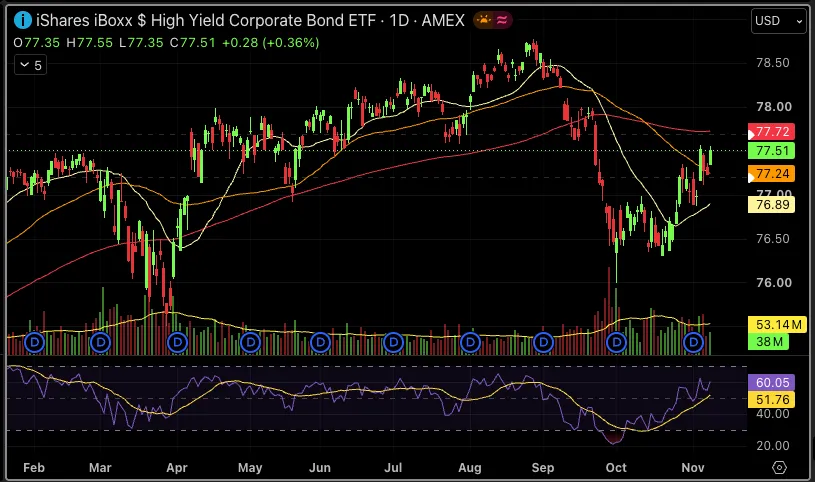
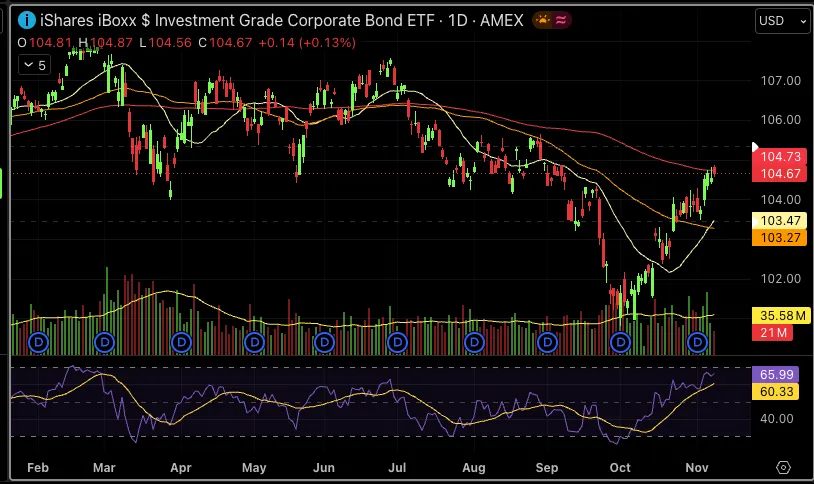
Credit is the line in the sand. Spreads are at their highest since the spring, though far from April 2025, when high-yield spreads blew out above 4.5%. More importantly, HYG and LQD, the ETFs institutions use to trade credit risk quickly, are already back at their 200-day averages. ETF prices tend to lead the spread indices, so this is an early sign that spreads will follow.
Macro: divided government is quietly disinflationary
With Congress in Democratic hands and the White House Republican, legislation slows, fiscal support becomes harder to deliver and new constraints on data centres add friction to one of the economy’s largest sources of investment. Over the medium term, slower growth and slower policy are disinflationary, and the dollar, which we believe has been trading rich, is rolling over. For equities that removes pressure on valuations. For AI it cuts both ways, which is why we use defined-risk structures.
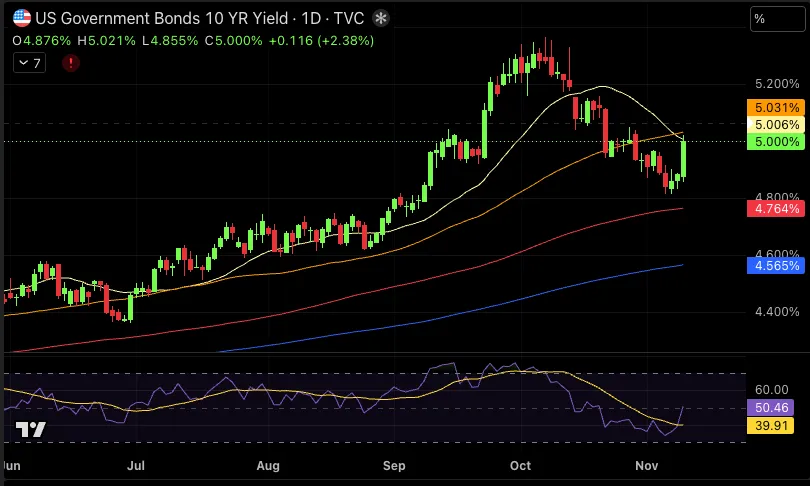
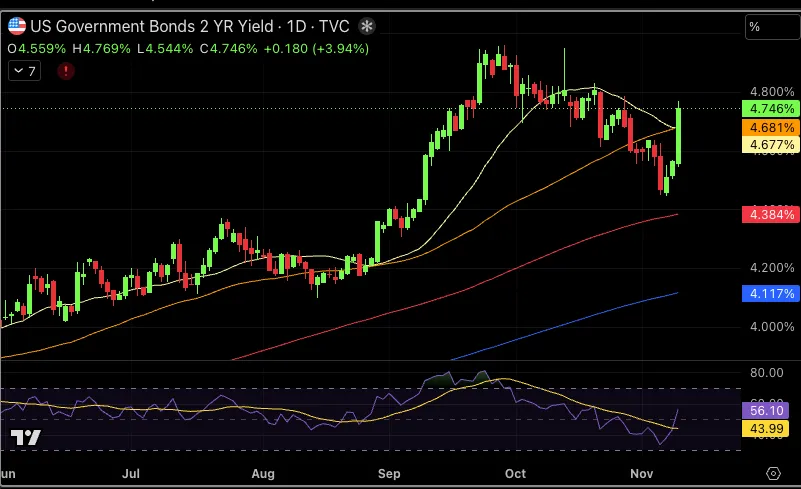
The near term is less comfortable. After falling from around 5.3% in October to about 4.86% last week, the 10-year yield has jumped back to 5.0%, and the 2-year rose 18 bp in a single session to 4.75% as markets priced more hikes. The reason is the diesel problem described below: expensive refined products are keeping inflation sticky, and central banks on both sides of the Atlantic are leaning hawkish. 5% on the 10-year is now the key level for the whole letter. Holding below it keeps our medium-term view intact; a sustained break above it would pressure long-duration assets, AI stocks and gold alike.
October CPI: slightly hot, but no new acceleration
Today’s CPI is a reminder that disinflation is a forward-looking story. Prices came in slightly above expectations: headline up 0.4% on the month against 0.3% expected, core up 0.3% against 0.2%. But headline slowed from September’s 0.6%, and core matched the 0.3% pace of August and September: firm, not accelerating. Energy rose 0.7%, the component we expect to reverse as November’s oil drop feeds through. Year-on-year rates were not published, because data collection lapsed during last year’s government shutdown.
| US CPI, October (MoM) | Actual | Consensus | Previous |
|---|---|---|---|
| Headline | 0.4% | 0.3% | 0.6% |
| Core (ex food and energy) | 0.3% | 0.2% | 0.3% |
The Fed: a December hike is fully priced
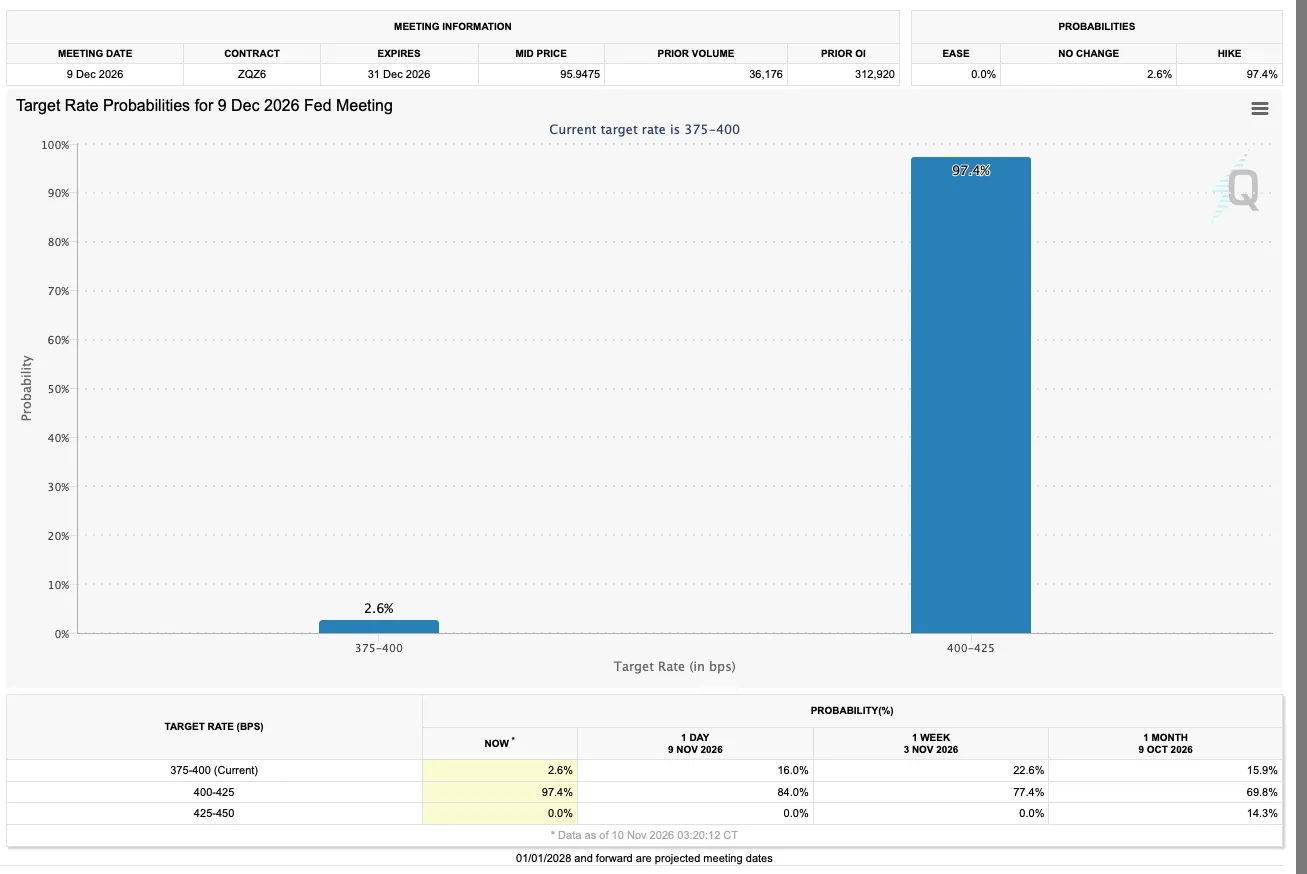
Markets price a 97% probability that the Fed raises rates on 9 December to 4.00–4.25%, up from 77% a week ago and 70% a month ago. That creates an asymmetry. Delivering a fully priced hike is not a new shock; the surprise can only run one way, and if the data give the Fed room to hold, pricing it out would be a strong tailwind for stocks and bonds. Today’s CPI did not provide that room, so the numbers to watch now are the odds of further hikes in January and March. For gold, the softness around the release has given us a better entry for Trade 01.
Oil: the problem isn’t crude anymore, it’s refined products
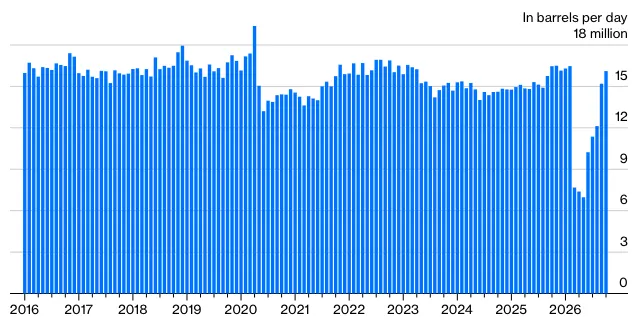
The oil story has changed. In the spring the problem was crude: a war premium priced on the risk of losing Hormuz. Today crude is flowing again. Brent has fallen nearly 25% in ten days to about $90 (Bloomberg). Middle East crude exports excluding Iran are back above 90% of pre-war levels, moving through Hormuz and the bypass pipelines and kept moving with workarounds such as ship-to-ship transfers, despite attacks on tankers. Many physical grades now trade at deep discounts to futures, and for the first time since the war began, global inventories are no longer drawing every week. Talks remain live, and a US–Iran deal could return up to about 2 million barrels a day of Iranian exports.
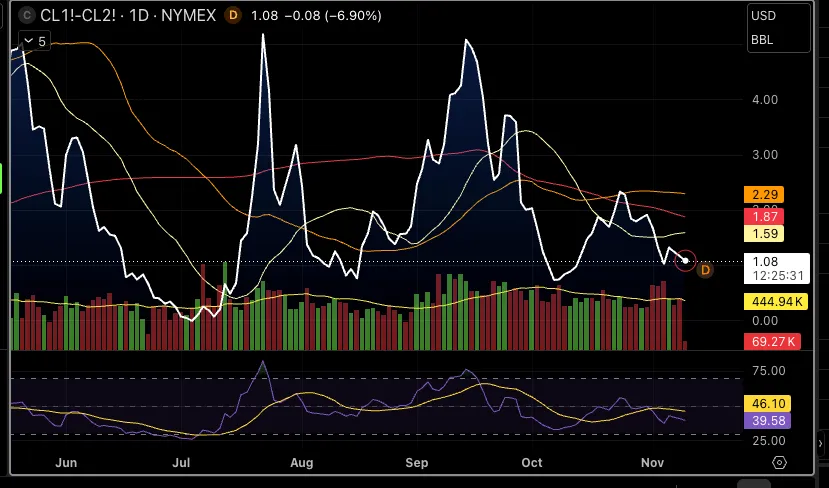
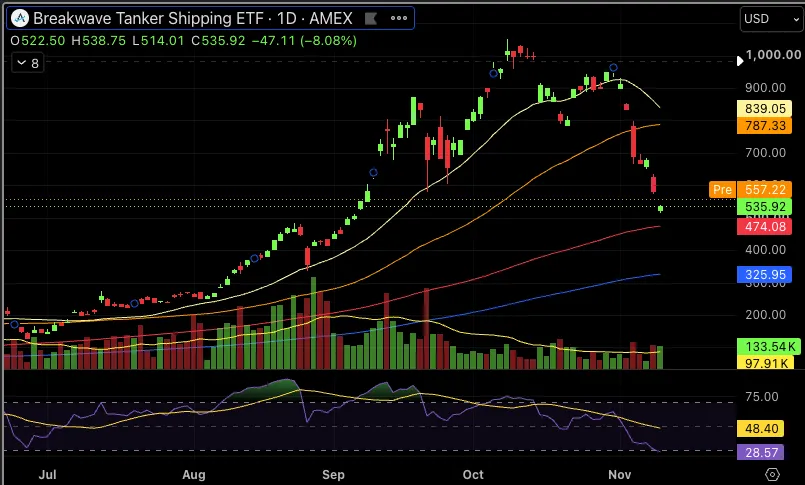
The futures curve confirms it. The Brent January–June 2027 spread collapsed from $11.71 to $6.58 in a week, the WTI front spread is back to about $1 from above $2, and Dated Brent’s premium over futures fell from $36.80 a month ago to $3.43. Buyers have stopped paying up for prompt crude. Freight is easing too: the Breakwave tanker shipping ETF, which tracks freight futures, has fallen roughly 45% from its October peak, and rates west of Suez are falling sharply, although a supertanker from the Gulf to China still costs about $1.4 million a day, against under $100,000 before the war. As Bloomberg’s Javier Blas argues, $90 is not the market pricing peace; it is the market pricing no immediate third round of fighting.
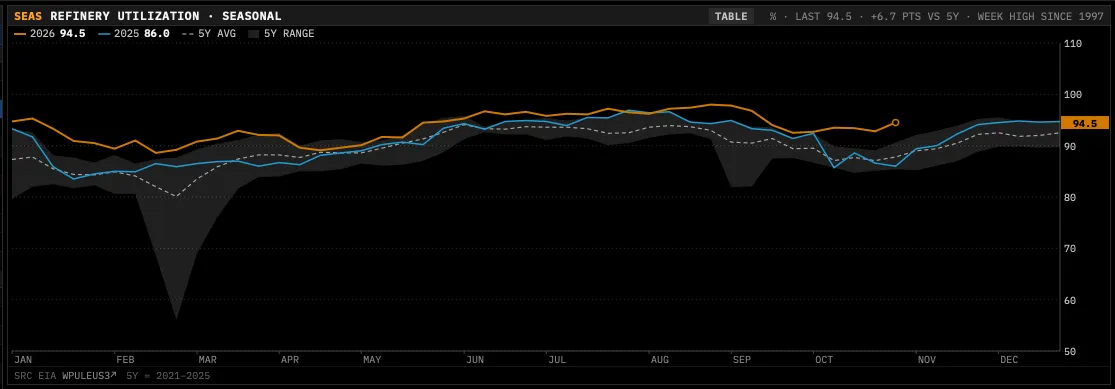
The bottleneck is now refined products. Gulf exports of diesel and jet fuel are running at only about 60% of pre-war levels, held back by a shortage of product tankers, and Ukrainian strikes on Russian refineries account for about a third of the rise in diesel prices. The diesel crack is around $84 a barrel and rose on the week while crude fell. US refineries are running at 94.5%, the highest for the week since 1997, and still cannot rebuild stocks: US distillate inventories are the lowest for the time of year since records began in 1982, and the SPR is about 35% below its five-year average.
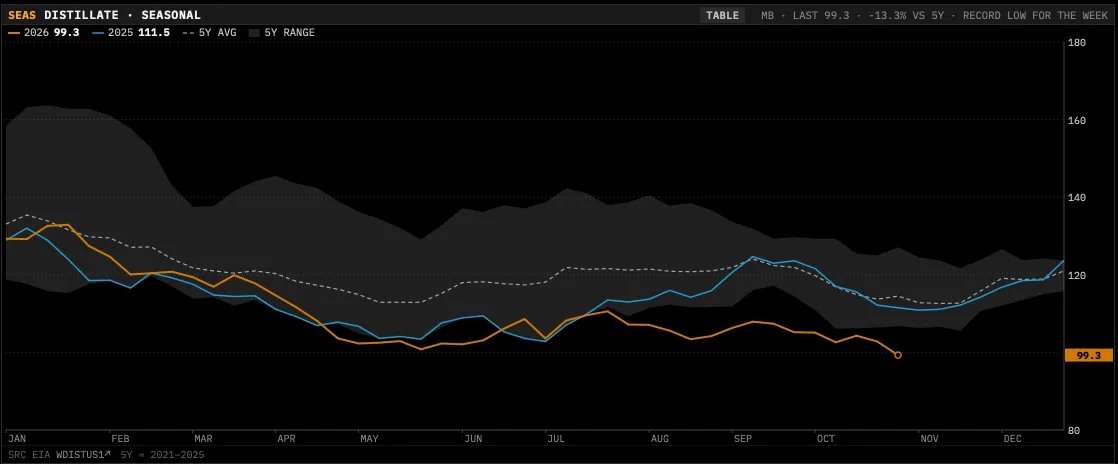
That matters for inflation more than the crude price does. Expensive diesel feeds directly into freight, food and, over time, wages, which keeps inflation sticky even as crude falls. It is the main reason the Fed, the Bank of England and the ECB are all signalling more hikes: Fed Governor Waller has said a 50 bp hike in December may be needed, citing diesel. The oil shock’s transmission channel has moved from oil prices to interest rates.
For crude itself, the outlook is two-sided. About $90 is wrong either way: too low if fighting resumes, too high if a deal is signed, which would point towards $70. Around 1 billion barrels of inventory have been drained and will need to be rebuilt, but China has historically restocked only with Brent below about $70, so that support sits well below today’s price. Our base case is a slow drift lower as discounted physical barrels weigh on futures, which favours options over directional positions in crude. Product cracks should stay wide, which benefits refiners outside the Gulf that buy cheaper crude and sell expensive diesel.
The catalyst calendar
The single most important event ahead is NVIDIA’s earnings on 17 November. It is the largest weight in the index and the centre of the AI trade: a sign of slowing growth would hit the whole market, while a clean report would remove the biggest overhang left from last week.
| When (CET) | Event | Previous | Consensus |
|---|---|---|---|
| Tue 10 Nov, 14:30 | US CPI (Oct, MoM), headline / core: released at 0.4% / 0.3% | 0.6% / 0.3% | 0.3% / 0.2% |
| Thu 12 Nov, 08:00 | UK GDP, Q3 preliminary (QoQ) | 0.5% | 0.7% |
| Thu 12 Nov, 14:30 | US initial jobless claims | 189K | 195K |
| Thu 12 Nov, 20:30 | ECB President Lagarde speaks | ||
| Mon 16 Nov, 14:30 | Canada CPI (Oct, YoY) | 3.1% | |
| Tue 17 Nov, 14:30 | US retail sales (Oct, MoM) | 0.8% | |
| Tue 17 Nov, after close | NVIDIA Q3 FY2027 earnings | ||
| Wed 18 Nov, 08:00 | UK CPI (Oct, YoY) | 3.5% | |
| Wed 18 Nov | VIX options & futures expiry | ||
| Fri 20 Nov | Monthly options expiry | ||
| Wed 9 Dec | FOMC decision | 3.75–4.00% | ~97% priced for +25 bp |
Highlighted: the events that matter most for our positions. Times CET. US markets are closed for Thanksgiving on 26 November, with a half-day on the 27th.
Our view: constructive, with patience built in
We are constructive on a one-to-three-month view, and we expect noise along the way. CTAs would sell again if the market turns lower, NVIDIA’s earnings are a binary event and credit spreads have not yet confirmed. That is why the trades below are option structures: they cap the loss upfront and give the mechanical flows time to clear.
From the trading desk: this week’s positions
Our trading desk turns the research above into three defined-risk positions and one hedge. Each comes with its structure, cost, payoff and the conditions that would make us wrong.
Gold: 390/405 Call Spread on GLD
About 2.6-to-1 reward-to-risk on gold reclaiming GLD $405 by February.
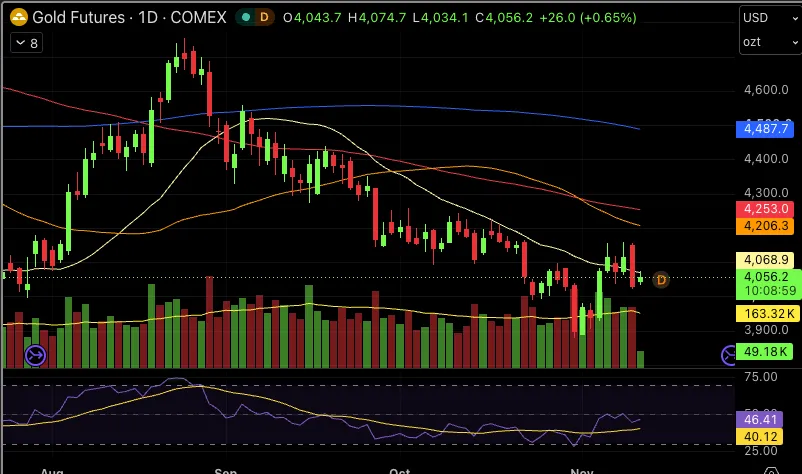
1. What held gold back: real yields. Gold pays nothing, so its biggest competitor is a safe bond that does. Between June and early October the US 10-year real yield climbed from about 2.0% to nearly 3.0%, and the nominal 10-year topped 5.3%. With a liquid Treasury paying more than 5%, or close to 3% after inflation, there was little reason to own gold as a store of value, and it slid from close to $4,700 to below $3,900.
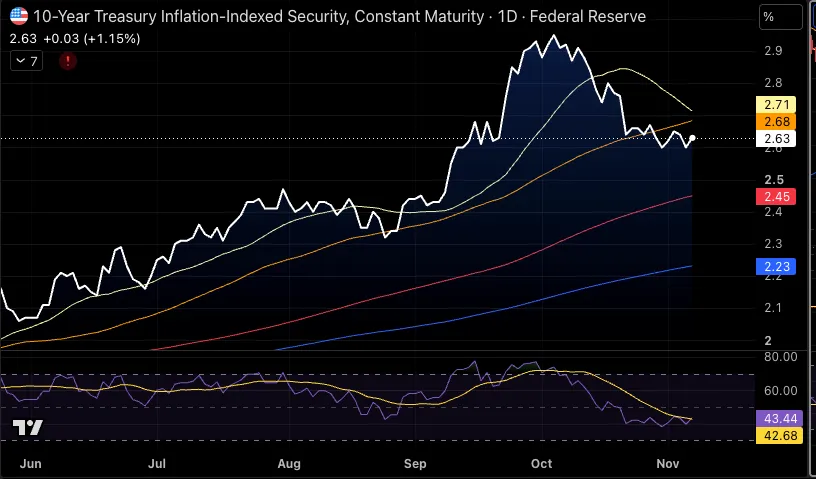
2. The trigger: the regime has turned. Real yields have eased to about 2.6% from nearly 3.0% in October. What matters is not the size of the move but its confirmation. Once the market accepted that the fall in yields was a genuine reversal rather than a dip, especially around the midterms, gold repriced within two to three days. That is typical of gold: it stays muted while the regime is against it, then moves quickly once the regime changes. We think that repricing has further to run, with one condition: the 10-year is retesting 5% this week, and a sustained break above it would put the regime change in doubt.
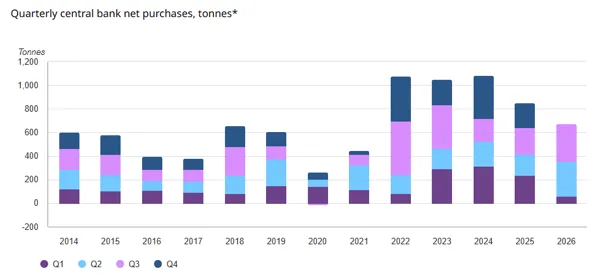
3. The structural buyer: central banks. Since 2022 central banks have bought more than 1,000 tonnes of gold a year, roughly double the pace of the previous decade, and they have already added about 670 tonnes in the first nine months of 2026. The motive is reserve security. Dollar reserves held abroad can be frozen, as Russia’s were in 2022; gold held at home cannot. As US policy has become more willing to use the financial system as a tool, more governments are diversifying out of dollars and into gold. That demand is price-insensitive and steady, and it puts a floor under every sell-off.
4. The hedge: fiscal and political risk. Gold also insures against governments overriding sound policy, pressure on central banks to accommodate deficits, and geopolitical shocks. Divided government, a Fed hiking into a slowing economy and an unresolved Middle East conflict keep that insurance in demand.
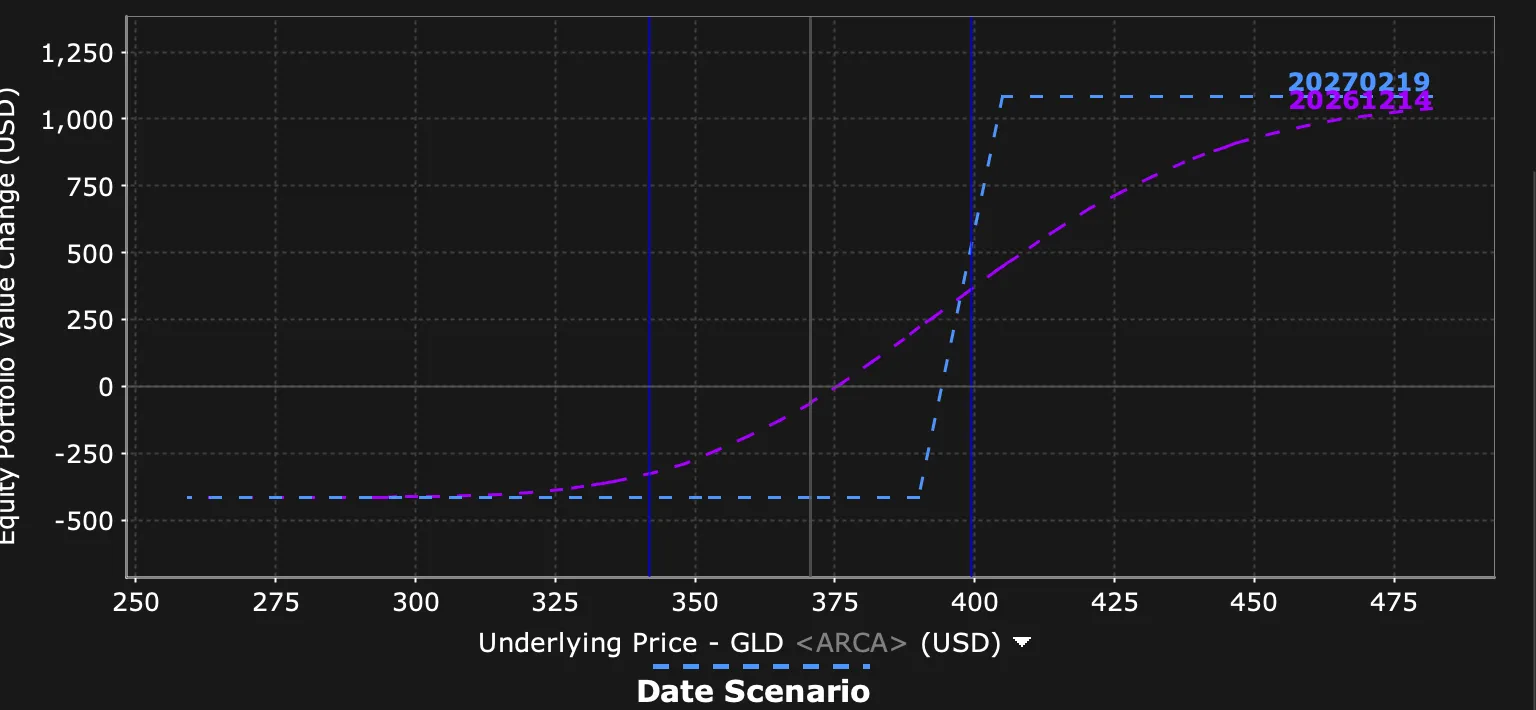
Why this structure. We use GLD rather than gold futures because the ETF’s strikes map cleanly onto the levels we are targeting. We buy the 390 call and sell the 405 call, both expiring 19 February 2027. Selling the 405 call cuts the cost sharply: we give up gains above $405, roughly $4,350 in gold futures, in exchange for a far better reward-to-risk ratio. The structure is simple and fully defined-risk, and the February expiry gives the move about three months to play out.
- Underlying
- GLD (SPDR Gold Shares)
- Structure
- Buy GLD 390 call / Sell GLD 405 call
- Expiry
- 19 February 2027 (~3 months)
- Max profit
- $1,084 per spread, with GLD at or above $405 at expiry
- Reward : risk
- ≈ 2.6 : 1
- Breakeven
- ≈ GLD $394 at expiry
- Key level
- US 10-year yield at 5%: a sustained break above it invalidates the trade
- What would kill it
- Real yields turning back up towards 3%; a dollar spike; a hawkish Fed beyond December
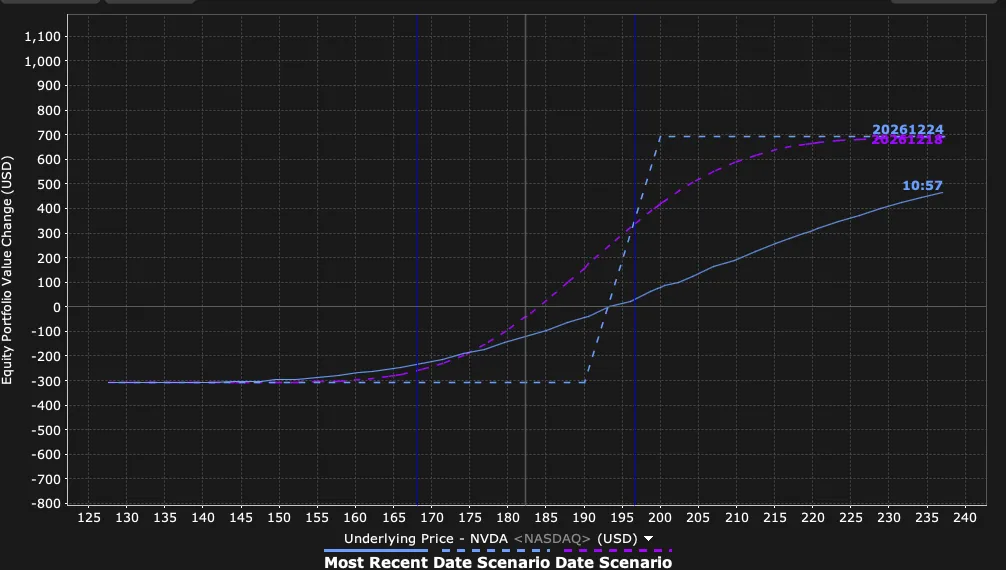
NVIDIA: 190/200 Call Spread
About 2.2-to-1 reward-to-risk on a recovery to $200 by Christmas Eve.
Thesis. NVIDIA fell 9.3% on Thursday, the largest single drag on the S&P 500, as the election raised fears that policy could slow the AI data-centre build-out. It fell again on Monday after a weekend espionage headline involving a customer, with no allegation of wrongdoing against the company. In our view both moves were driven by fear, not fundamentals, and Thursday’s was amplified by forced selling into negative dealer gamma. Nothing in the past week’s news changed near-term demand for NVIDIA’s chips. As the mechanical flows clear and the headline fades, we expect the stock to recover towards $200, the strike with the heaviest call open interest, which tends to act as a magnet.
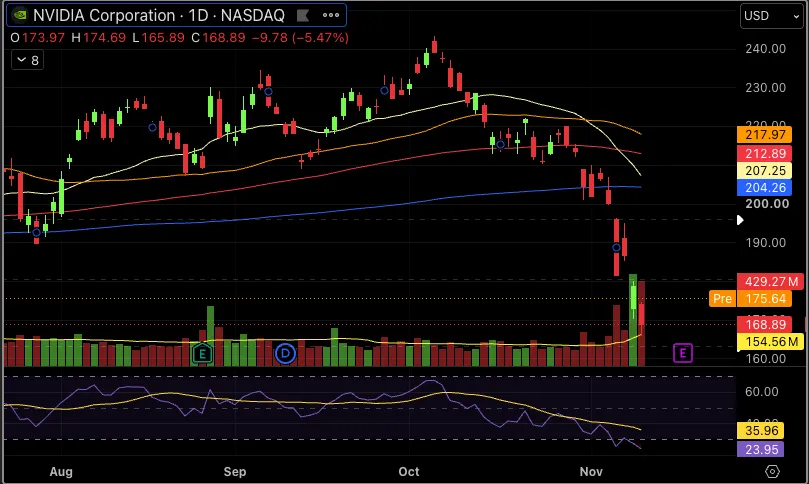
The selling has not stopped yet. NVIDIA closed Tuesday at $168.89, down a further 5.5%, and is indicated around $175.6 before today’s open, well below every major moving average. That makes the entry cheaper, but it also raises the bar: from current levels the stock needs to rise roughly 10% to reach breakeven and about 14% to reach $200.
Why a call spread. Selling the 200 call against the long 190 call cuts the cost of the trade sharply. We give up upside above $200, which is our target anyway, in exchange for a much better reward-to-risk ratio. The spread runs through NVIDIA’s earnings on 17 November, which is the catalyst that can either validate the recovery or break it: the defined risk is deliberate.
- Structure
- Buy NVDA 190 call / Sell NVDA 200 call
- Expiry
- 24 December 2026 (~6 weeks)
- Cost (max loss)
- $309 per spread
- Max profit
- $691 per spread, with NVDA at or above $200 at expiry
- Reward : risk
- ≈ 2.2 : 1
- Breakeven
- ≈ $193.1 at expiry
- Key event inside the trade
- NVIDIA Q3 earnings, 17 November (after the close)
- What would kill it
- Weak earnings or guidance; concrete legislation restricting data-centre build-out; escalation of the China/customer probe
Compass Pathways (CMPS): $10 Calls
From our biotech research desk: positioning for FDA approval of COMP360, expected around mid-January.
The company. Compass Pathways is developing COMP360, a synthetic psilocybin capsule given in a few monitored sessions a year for treatment-resistant depression. The condition affects about 4 million US adults, and the only approved drug, J&J’s Spravato, has under 3% of that market.
The data. COMP360 met its primary endpoint in two Phase 3 trials with 839 patients, beating control by 3.6 and 3.8 points on the MADRS depression scale (both p<0.001), with a clear dose response. On depth of effect it does not beat its rivals: the gap is similar to Spravato’s and below newer competitors. Its edge is treatment burden. By week 9 a COMP360 patient has had two dosing sessions against about twelve for Spravato, and over a first year it needs 1 to 4 sessions against 34 to 56. Roughly the same benefit for a fraction of the clinic visits matters to patients, to clinics with limited treatment rooms, and potentially to payers.
The catalyst. COMP360 has held Breakthrough Therapy designation since 2018 and carries a National Priority Voucher targeting a review of one to two months. Management said on 3 November that the filing would be completed within two weeks, citing a median review of about 60 days. With no formal decision date, that points to an FDA decision around mid-January 2027, followed by DEA rescheduling and a launch guided for the first half of 2027. Cash of $433 million against $51 million of debt funds the company into 2028, past launch.
Why the stock is mispriced. The shares fell more than 35% after reports that Usona filed for approval of its own psilocybin on 2 November, also with a priority voucher, putting Compass’s first-to-market advantage in doubt. At about $9, the stock trades below its pre-Usona level of $11.70. We expect approval, and a repricing to $14–16 as investors refocus on COMP360’s convenience advantage and Compass’s likely head start. That is still below the median analyst target of about $21. Options positioning is notable too: the January $20 calls hold about 14,000 contracts of open interest, roughly 1% of shares outstanding.
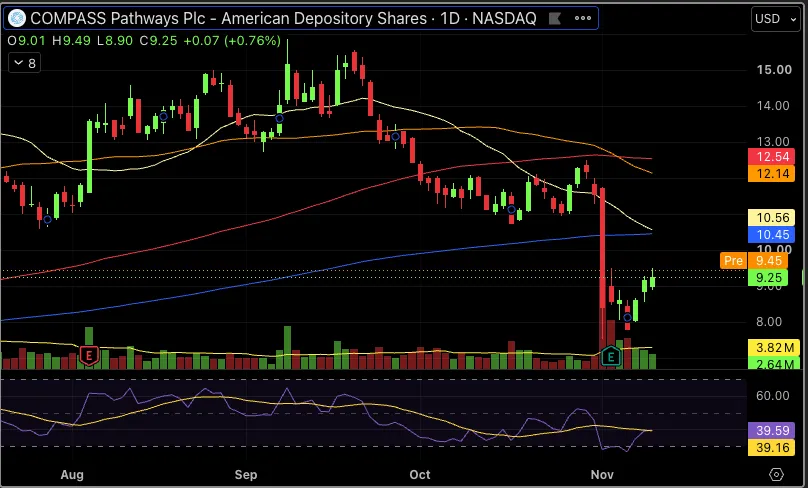
Why calls. A regulatory decision is close to binary. Calls cap our loss at the premium paid while keeping full exposure to an approval, and a $10 strike sits just above the current price, so an approval-driven move to $14–16 would put them well in the money.
- Structure
- Buy CMPS $10 calls
- Expiry
- After the mid-January FDA decision
- Max loss
- The premium paid
- Breakeven
- $10 + premium at expiry
- Target
- Stock at $14–16 after approval
- Catalyst
- FDA decision, expected around mid-January 2027
- Position sizing
- Small: a binary regulatory event in a near single-asset company
Status of open positions
This is our first issue, so there are no open positions from previous letters.